Time to demand the evidence to support continued COVID19 lockdowns and restrictions
29 Oct 2020 Update
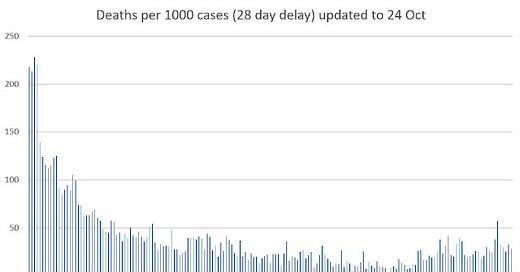
Here is a new plot:
As I usual I am using only the data from https://coronavirus.data.gov.uk. The above plot shows the number of UK COVID19 deaths per 1000 cases with a 28-day delay (the reason for the delay is because of the delay between confirmed cases and death).
The 28-day delay simply means we divide the number of deaths reported…
Keep reading with a 7-day free trial
Subscribe to Where are the numbers? by Norman Fenton and Martin Neil to keep reading this post and get 7 days of free access to the full post archives.


