Where are the numbers? by Norman Fenton and Martin Neil

Where are the numbers? by Norman Fenton and Martin Neil

Share this post

Where are the numbers? by Norman Fenton and Martin Neil
UK: Plotting new Covid cases per 1000 tested

UK: Plotting new Covid cases per 1000 tested

Norman Fenton's avatar
Norman Fenton
Sep 17, 2020
∙ Paid
1

Share this post

Where are the numbers? by Norman Fenton and Martin Neil
UK: Plotting new Covid cases per 1000 tested
Share

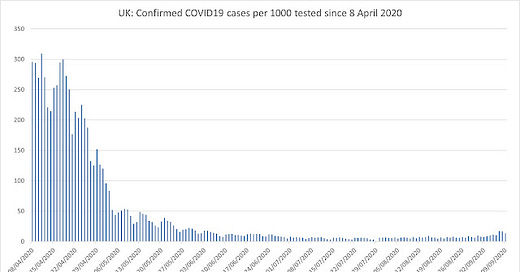
Following on from my analysis of the trend in Covid deaths (and using the same dataset), here is a plot (for each day since 8 April*) of the number of new cases per 1000 people tested. Contrary to what is being shown by the media (see below), this plot is the one that should be used to base decisions on if and when new social distancing or lockdown rule…

Keep reading with a 7-day free trial

Subscribe to Where are the numbers? by Norman Fenton and Martin Neil to keep reading this post and get 7 days of free access to the full post archives.

Already a paid subscriber? Sign in
© 2025 Martin Neil and Norman Fenton
Privacy ∙ Terms ∙ Collection notice
Start writingGet the app
Substack is the home for great culture

Share