Discover more from Where are the numbers? by Norman Fenton and Martin Neil
What the number does and does not mean
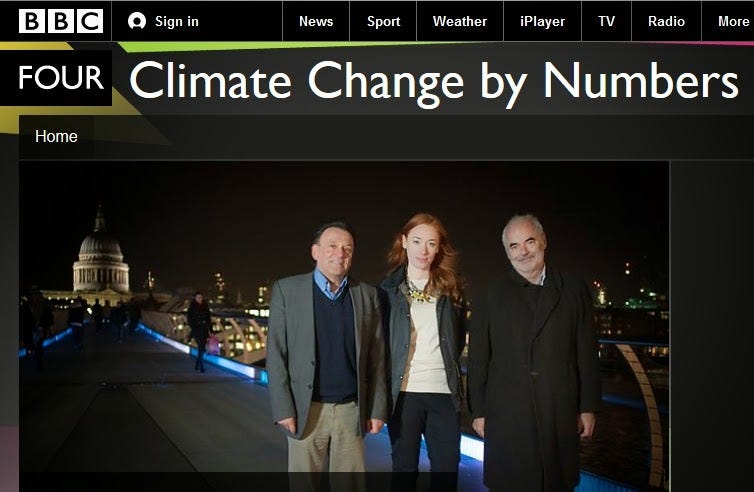
In 2015 I was one of the presenters of the BBC documentary Climate Change by Numbers. My summary of the experience is described here.
The particular 'climate change number’ that I was asked to explain was the number 95: specifically, relating to the assertion made in the IPCC 2013 Report report of “at least 95% degree of certainty that more than half the recent warming is man-made”.
The ‘recent warming’ related to the period 1950-2010. So, the assertion is about the probability of humans causing most of this warming.
Before explaining the problem with this assertion we need to make clear that (although superficially similar) it is very different to another more widely known assertion (still promoted by NASA) that “97% of climate scientists agree that humans are causing global warming and climate change”. That assertion was simply based on a flawed survey of authors of published papers and has been thoroughly debunked.
The 95% degree of certainty is a more serious claim. But the case made for it in the IPCC report is also flawed. To explain why, it is useful to illustrate the flaw with a simple motivating example.
The fundamental flaw: coin tossing example
Imagine that there are known to be some double headed coins in circulation. Suppose a coin is randomly selected and, without inspecting it, it is tossed five times. Each time the result is Heads. What is the probability that the coin is double-headed? Most people intuitively believe it is very likely to be one of the double-headed coins. But that is a fallacy.
In classical statistical hypothesis testing it is not possible to make any direct conclusions about the hypothesis that the coin is double-headed. Instead, the observation of the five consecutive Heads is used to either accept or reject the ‘null hypothesis’ (that the coin is NOT double-headed) at some agreed level of significance. Specifically, we compute the probability that we would have observed five consecutive heads if the coin was not double-headed. In this case the probability is 1/32 which is about 3%. So that is indeed very unlikely. Typically, a 5% level of significance (also called the p-value) is used, meaning that we ‘reject’ the null hypothesis in this case because the probability is less than 5%.
Note that we can equivalently conclude that there is a very high probability (97%) that we would not have observed five consecutive heads if the coin was not double headed.
Unfortunately, people often conclude (wrongly as we will show) that rejecting the null hypothesis at the 5% significance level means there is less than 5% probability that the coin is not double-headed. And hence they further conclude that we can be at least 95% confident that the coin is double-headed. But that is wrong.
While the evidence of the five consecutive Heads certainly provides some support for the hypothesis that the coin is double-headed, it tells us nothing about the probability that it really is double-headed. The only way we can make any firm conclusion about that probability is if we have some knowledge of the ‘prior probability’ that the coin was double-headed; in this case that means knowing what proportion of coins in circulation are double-headed. It will make a big difference if is 1 in 2, 1 in 100, 1 in 1000, 1 in a million etc.
If we know the proportion of double headed coins in circulation, then Bayes’ theorem can be used to calculate the answer we seek. Let’s suppose, for example, that we know there are 1 in 500 double headed coins in circulation (so the prior probability a coin is double-headed is 1 in 500 which is 0.2%). The formal calculation is below*, but we can give an intuitive explanation without resorting to the Bayes formula:
Imagine a bag of 500 coins in which exactly one is double-headed (i.e. a typical bag of coins in this case). Suppose we test each coin by tossing it five times. Then we are certain that the (one) double-headed coin will result in 5 heads.
But, 1 in every 32 of the other 499 fair coins - that is about 16 fair coins - will also result in five consecutive heads.
So for every 17 coins recording five consecutive heads, there is only one which is double-headed.
So, if we know that a coin has recorded five consecutive heads what we can conclude is that there is a 1 in 17 chance (that is about 6%) that it is double headed, i.e. about a 94% chance it is not double-headed.
So, whereas it is very unlikely to observe 5 consecutive heads if the coin is not double headed (probability 3%), it is still very likely that the coin is not double headed (probability 94%).
The fallacy of concluding that there was only a small probability that the coin is not double headed is called the fallacy of the transposed conditional (or ‘prosecutor fallacy’) because we have assumed that:
the probability of an assertion E given an assertion “not H”
is the same as
the probability of “not H” given E.
In this case
H is the hypothesis: “selected coin is double-headed”
E is the evidence: “5 consecutive Heads tossed”
And we have shown that
Probability of (E given not H) = 3%
whereas
probability of (“not H” given E) = 94%
The flaw in the IPCC summary report
It turns out that the assertion that “at least 95% degree of certainty that more than half the recent warming is man-made” is based on the same fundamental flaw as assuming in the above example that there is at least a 95% chance the coin is double-headed.
In my article about the programme I highlighted this concern as follows:
The real probabilistic meaning of the 95% figure. In fact it comes from a classical hypothesis test in which observed data is used to test the credibility of the ‘null hypothesis’. The null hypothesis is the ‘opposite’ statement to the one believed to be true, i.e. ‘Less than half the warming in the last 60 years is man-made’. If, as in this case, there is only a 5% probability of observing the data if the null hypothesis is true, the statisticians equate this figure (called a p-value) to a 95% confidence that we can reject the null hypothesis. But the probability here is a statement about the data given the hypothesis. It is not generally the same as the probability of the hypothesis given the data (in fact equating the two is often referred to as the ‘prosecutors fallacy’, since it is an error often made by lawyers when interpreting statistical evidence).See here and here for more on the limitations of p-values and confidence intervals.
The claim that there was at least 95% probability that more than half the warming was man-made was made in the “Summary for Politicians” section of the 2013 IPCC Report.
(“extremely likely” was defined as at least 95% probability)
But when we look at the basis for the claim in Chapter 10 of the detailed Technical Summary, it is clear from the methods and results that the claim is based on various climate change simulation models, which reject the null hypothesis (that more than half the warming was not man-made) at the 5% significance level.
Specifically, in the simulation models if you assumed that there was little man-made impact, then there was less than 5% chance of observing the warming that has been observed. In other words the models do not support the null hypothesis of little man-made climate change. The problem is that, even if the models were accurate (and we dispute that they are) we cannot conclude that there is at least a 95% chance that more than half the warming was man-made. Because doing so is the fallacy of the transposed conditional.
All we can conclude is that there is at least a 95% probability we would not observe the warming we have seen based on the climate change model simulations and their multiple assumptions. Just like there was a 96% probability we would not observe 5 consecutive Heads on a coin that was not double-headed.
The illusion of confidence in the coin example comes from ignoring (the ‘prior probability’) of how rare the double-headed coins are. Similarly, in the case of climate change there is no allowance made for the prior probability of man-made climate change; only the assumptions of the simulation models are allowed, and other explanations are absent. In both of these circumstances classical statistics can then be used to deceive you into presenting an illusion of confidence when it is not justified.
* Bayes Theorem calculation for double headed-coin example:
H is the hypothesis: “selected coin is double-headed”
E is the evidence: “5 consecutive Heads tossed”
We are assuming P(H) = 1/500, so P(not H) = 499/500
We know P(E | not H) = 1/32 and P(E | H) =1
And here’s a video explaining the prosecutor’s fallacy:
Climate change by flawed numbers
A Climate expert that did not go along with the narrative.
https://youtu.be/7LVSrTZDopM
It's of course correct that rejecting a hypothesis at the 5% level doesn't mean that there is a 95% confidence in the alternative. However, in the case of global warming, we really only have two options (natural, not-natural/anthropogenic). If we can reject with 95% confidence that more than 50% of the observed warming was natural, then we can say that it is extremely unlikely that more than 50% of the observed warming was natural. Is it then strictly correct to say that it is extremely likely that more than 50% of the warming was anthropogenic? Maybe from a strictly statistical perspective this is wrong, but given that there isn't an alternative in reality, it's hard to see how it's all that misleading (i.e., if we're very confident that nature can't be responsible for more than 50% of the observed warming, then we can be pretty confident that more than 50% of it is anthropogenic/man-made).